
Know what you're breathing.
Continuous indoor air quality monitoring with on-device clarity and cloud-connected insights. See it. Track it. Act on it.
Methodology
Aligned with the standards that matter
Thresholds and methodology based on EPA NAAQS, WHO Air Quality Guidelines, and ASHRAE 62.1/55. Powered by Sensirion sensor technology. Building toward RESET certification.
- EPA NAAQS
- WHO AQG
- ASHRAE 62.1 / 55
- Sensirion
- RESET (in progress)
The air inside your home is hurting you. You just can't see it.
more polluted than outdoor air on average.
Source: EPA
of your life is spent indoors.
Source: WHO
cognitive decline when CO₂ exceeds 1000 ppm.
Source: Harvard, 2016
Indoor air carries CO₂ from breathing, particulates from cooking and cleaning, volatile organic compounds from furniture and finishes, and nitrogen oxides from gas appliances. None of these are visible. Most are odorless. All affect how you sleep, think, and feel. Lumair makes the invisible visible.
How Lumair works.
Sense
Six precision sensors capture CO₂, particulates, VOCs, NOx, temperature, and humidity every second.
Show
The 2.8-inch touchscreen displays your air quality at a glance. No phone required.
Sync
Readings push to your private dashboard every minute. Track trends, set alerts, see history from anywhere.
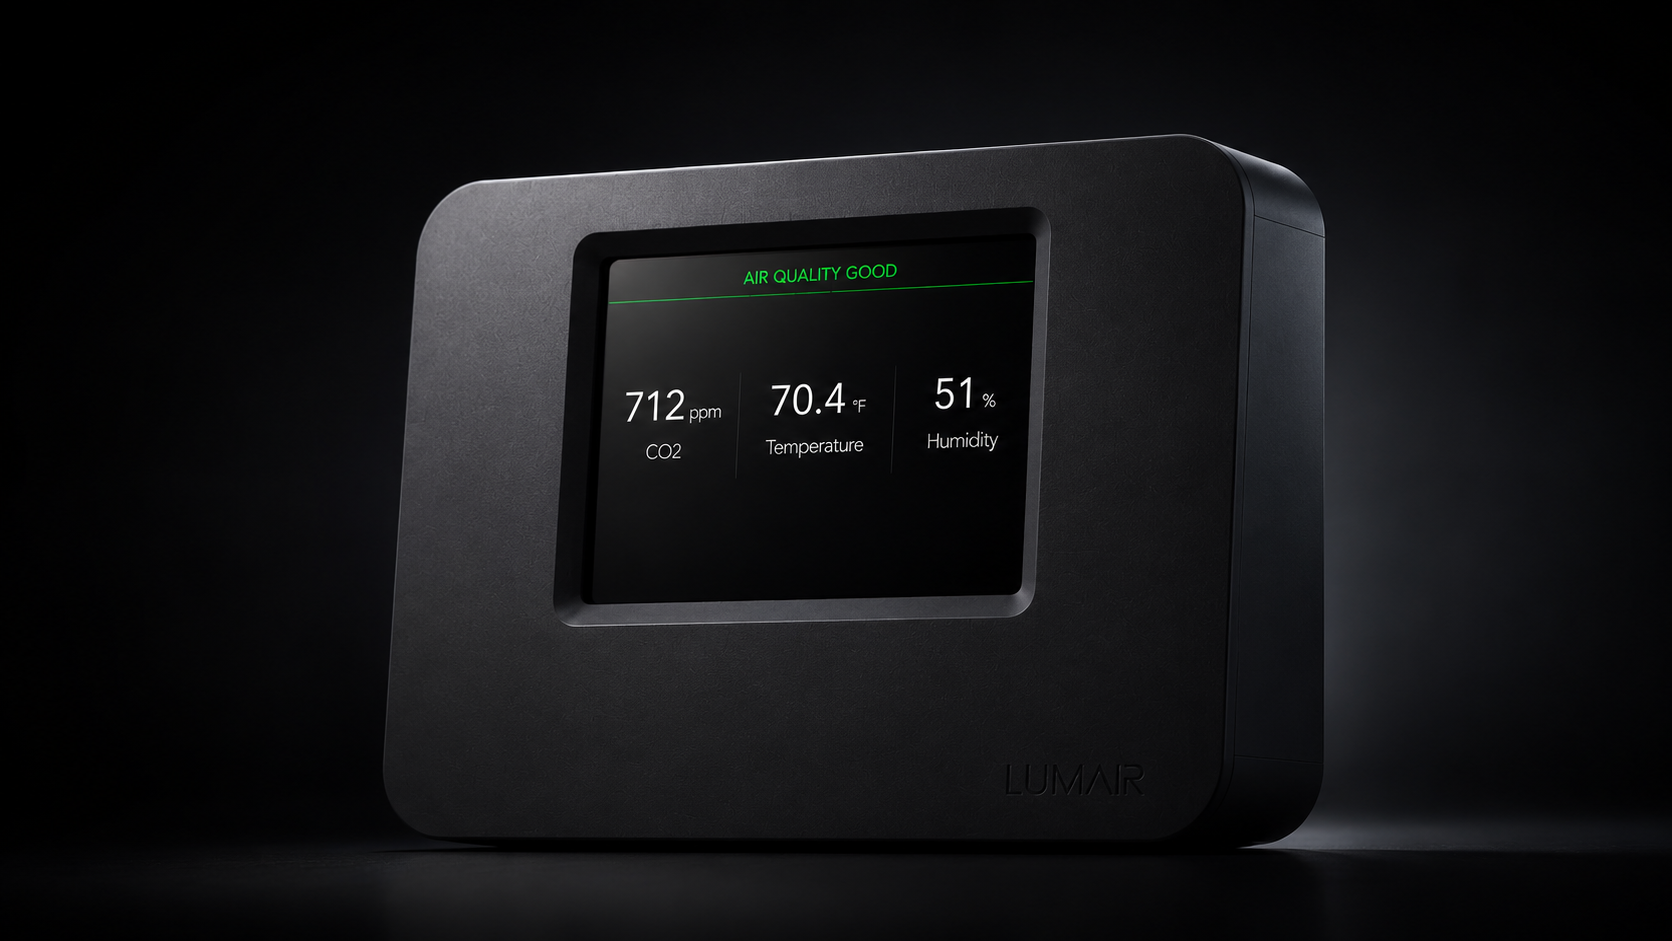
On the device
Five pages of clarity. No setup, no apps to open.
Swipe through real-time readings on a bright 2.8-inch touchscreen. Air quality status in plain English. Threshold-based color coding. Touch settings to adjust brightness, switch units, or check device info. Lumair works the moment you plug it in.
On the platform
The full picture, from anywhere.
Your Lumair dashboard tracks every reading, every minute, going back as far as you've owned the device. Watch trends across hours, days, or weeks. Switch between multiple devices in your home or office. See exactly when air quality slipped, what triggered it, and what to do about it.
- Real-time readings with sub-second updates
- Historical charts (1 hour / 24 hours / 7 days / custom)
- Multi-device support with quick switching
- Air Quality Score (0–100) across all metrics
- CSV export for analysis or compliance
- Mobile-responsive — works on every device

Every metric that matters indoors.
CO₂
Carbon dioxide builds up in enclosed spaces and impairs focus, sleep, and cognitive function.
Healthy: under 800 ppm
PM1.0
Ultra-fine particles from cooking, candles, and combustion that penetrate deep into your lungs.
Healthy: under 10 µg/m³
PM2.5
Fine particles linked to cardiovascular and respiratory disease. EPA's primary outdoor air metric.
Healthy: under 12 µg/m³
PM4.0
Coarse particles from dust, pollen, and mechanical activity in your living space.
Healthy: under 25 µg/m³
PM10
Larger particles you can see in sunbeams — dust, mold spores, pollen.
Healthy: under 50 µg/m³
VOC
Volatile organic compounds from furniture, paint, cleaning products, and personal care items.
Healthy: under 150 index
NOx
Nitrogen oxides from gas stoves, fireplaces, and water heaters — a respiratory irritant.
Healthy: under 20 index
Temperature
Indoor temperature affects sleep, focus, and humidity perception.
Healthy: 18–26 °C · 65–78 °F
Humidity
Too dry irritates airways; too humid promotes mold and dust mites.
Healthy: 40–60%
Use cases
Wherever air quality matters.
From homes to restaurants, schools to clinics — Lumair scales with your space.
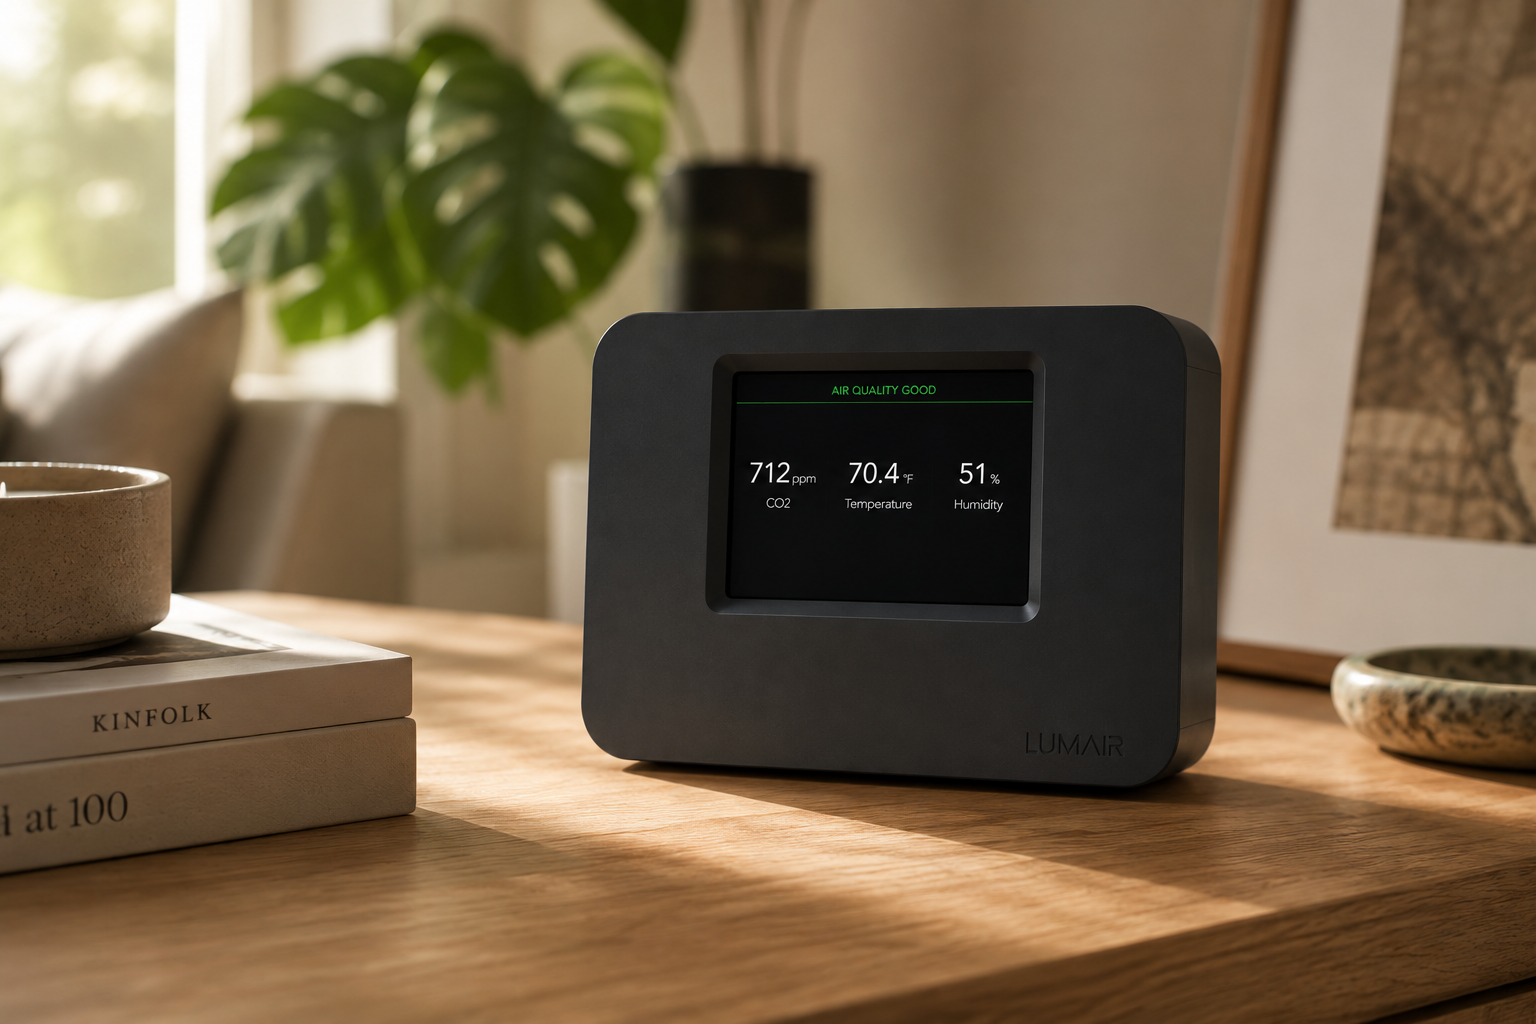
For your home
Sleep better. Think clearer. Keep your family healthy. Lumair monitors what your air filter and HVAC can't see.
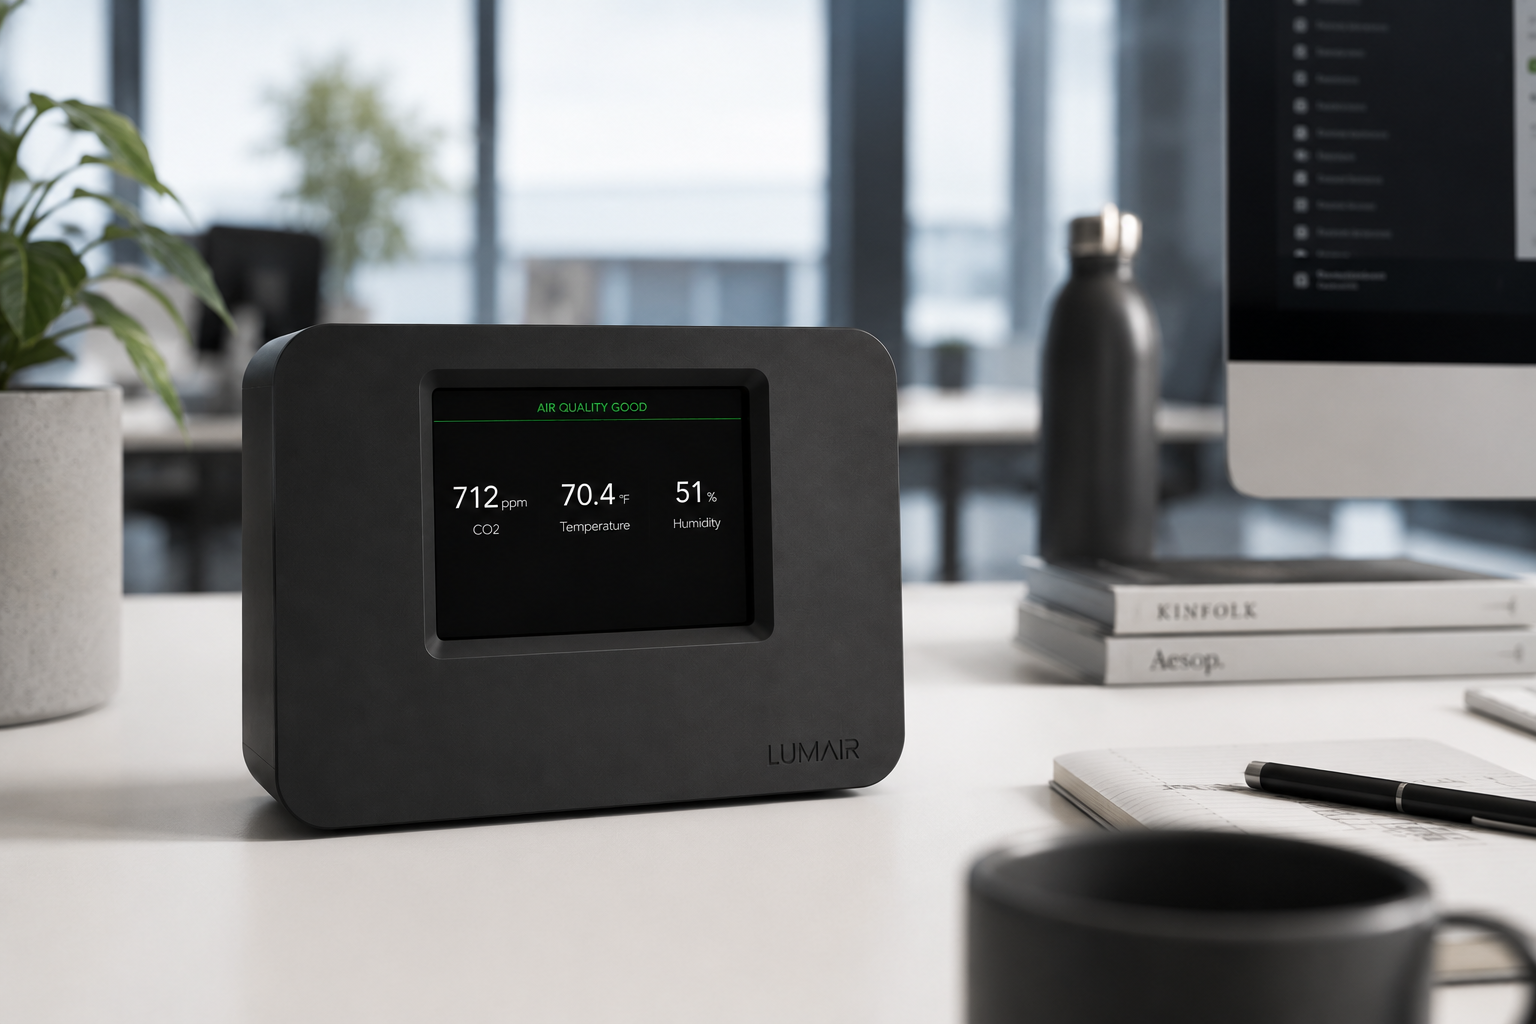
For your office
Monitor meeting rooms, open plans, and shared workspaces. Reduce sick days, boost team focus, and prove your commitment to employee wellbeing.
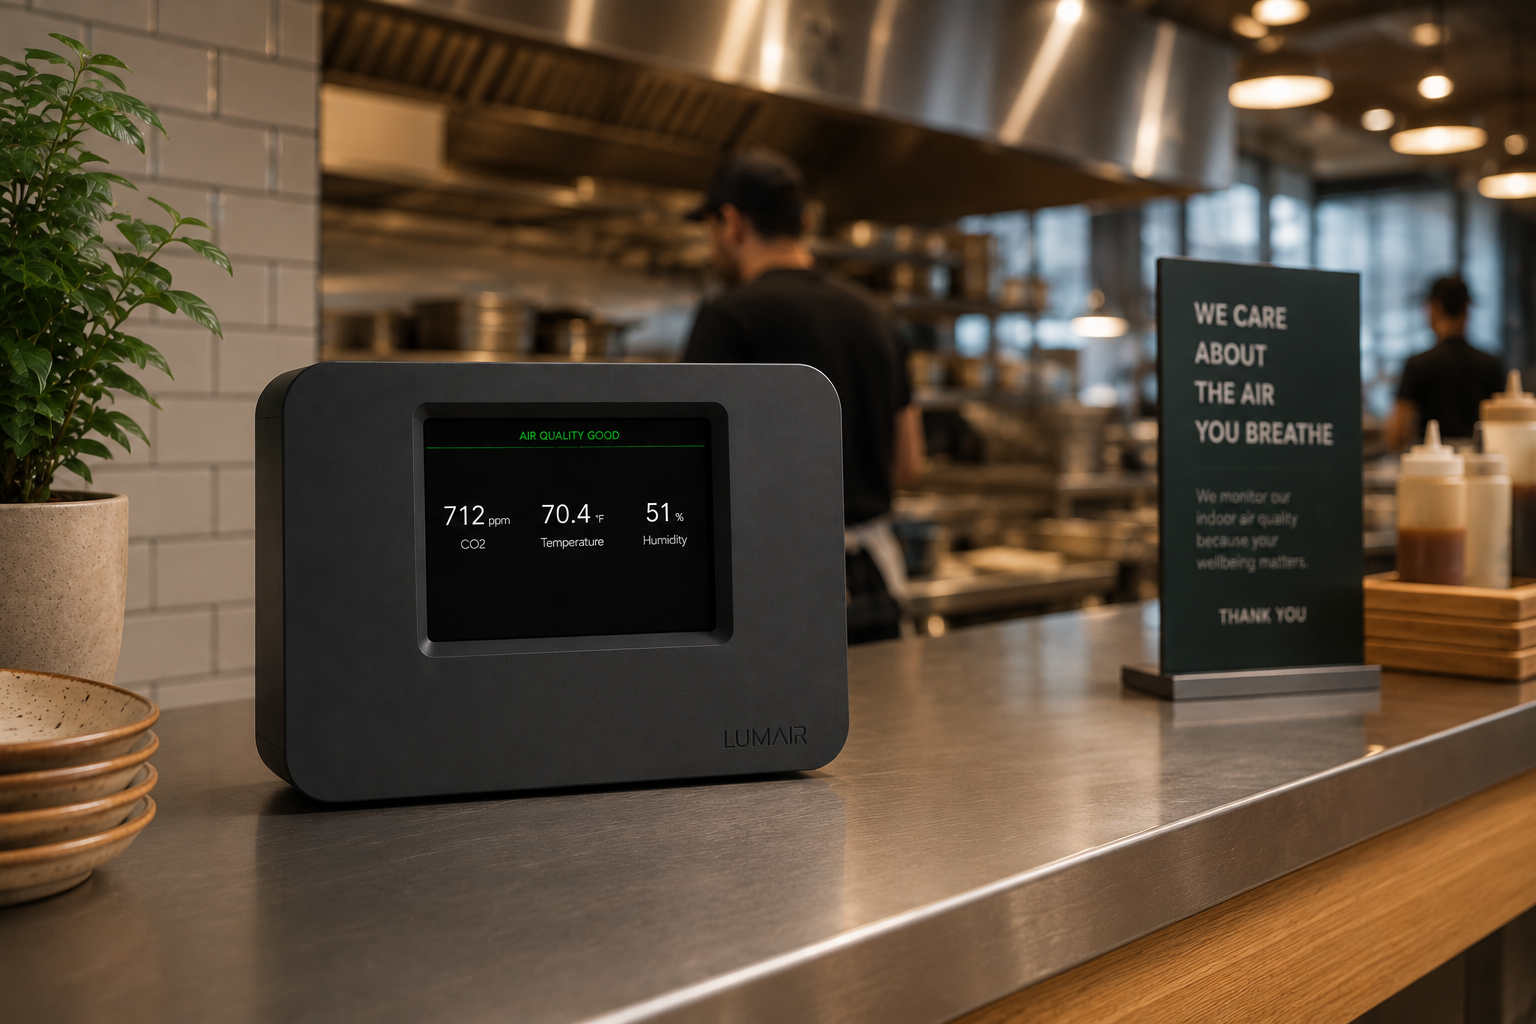
For your restaurant
Cooking emissions, gas appliances, and foot traffic put strain on indoor air. Protect your staff and customers, and demonstrate compliance with food service air quality standards.
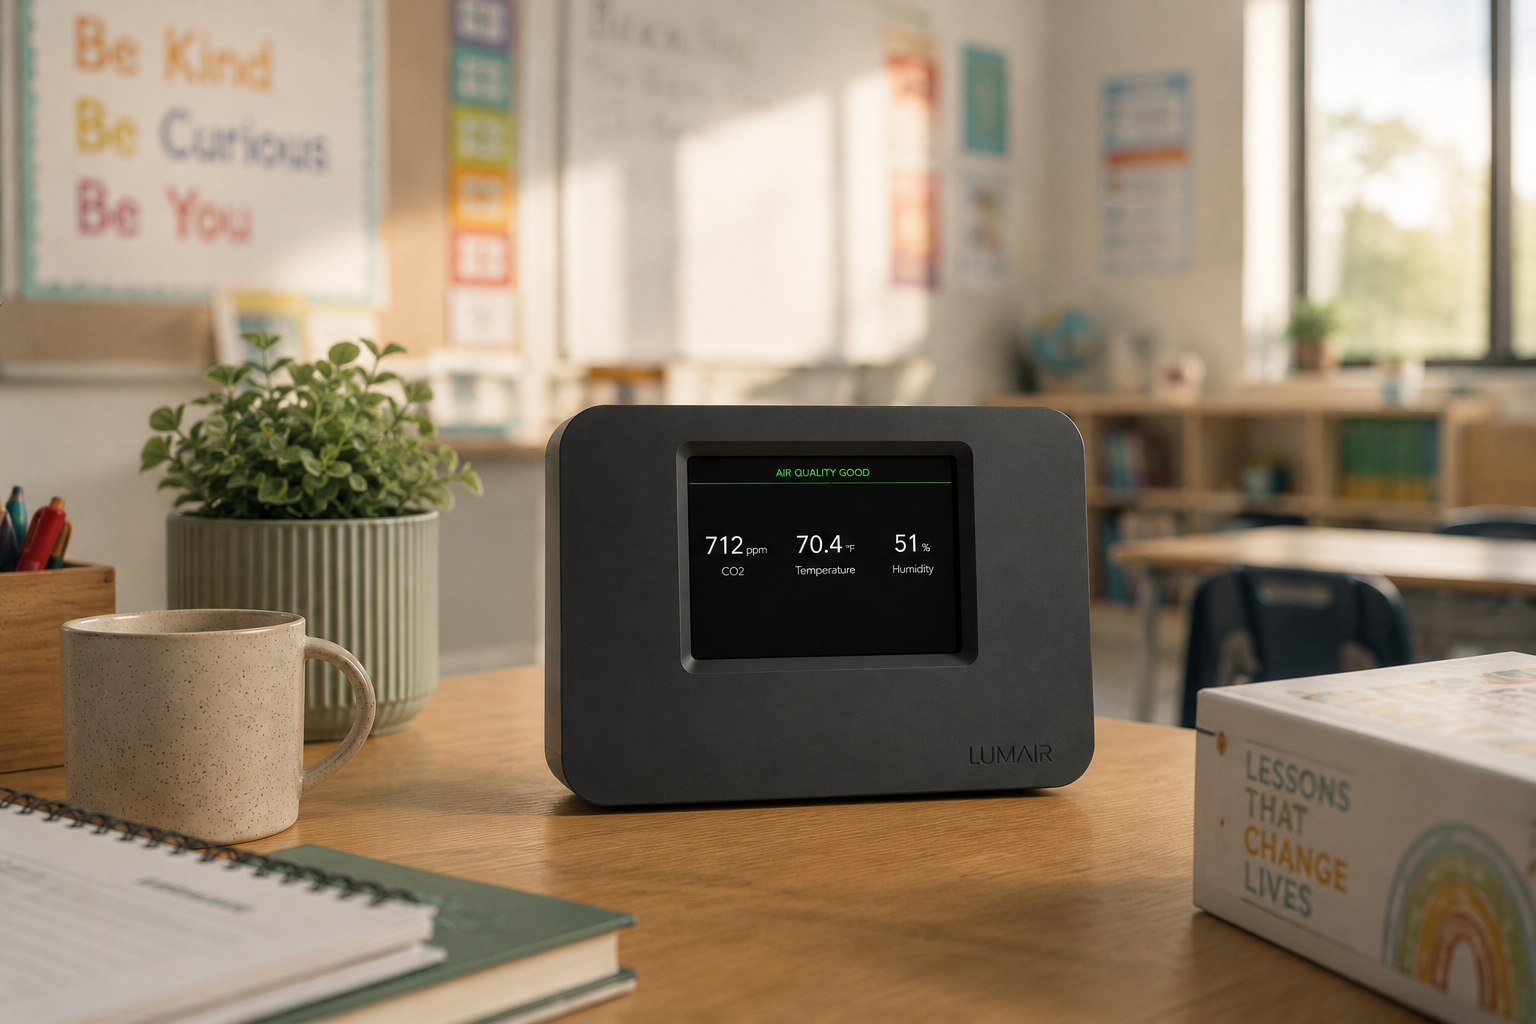
For your classroom
Studies show CO₂ above 1000 ppm reduces student test performance by up to 21%. Track it. Manage it. Give every student their best chance to focus.
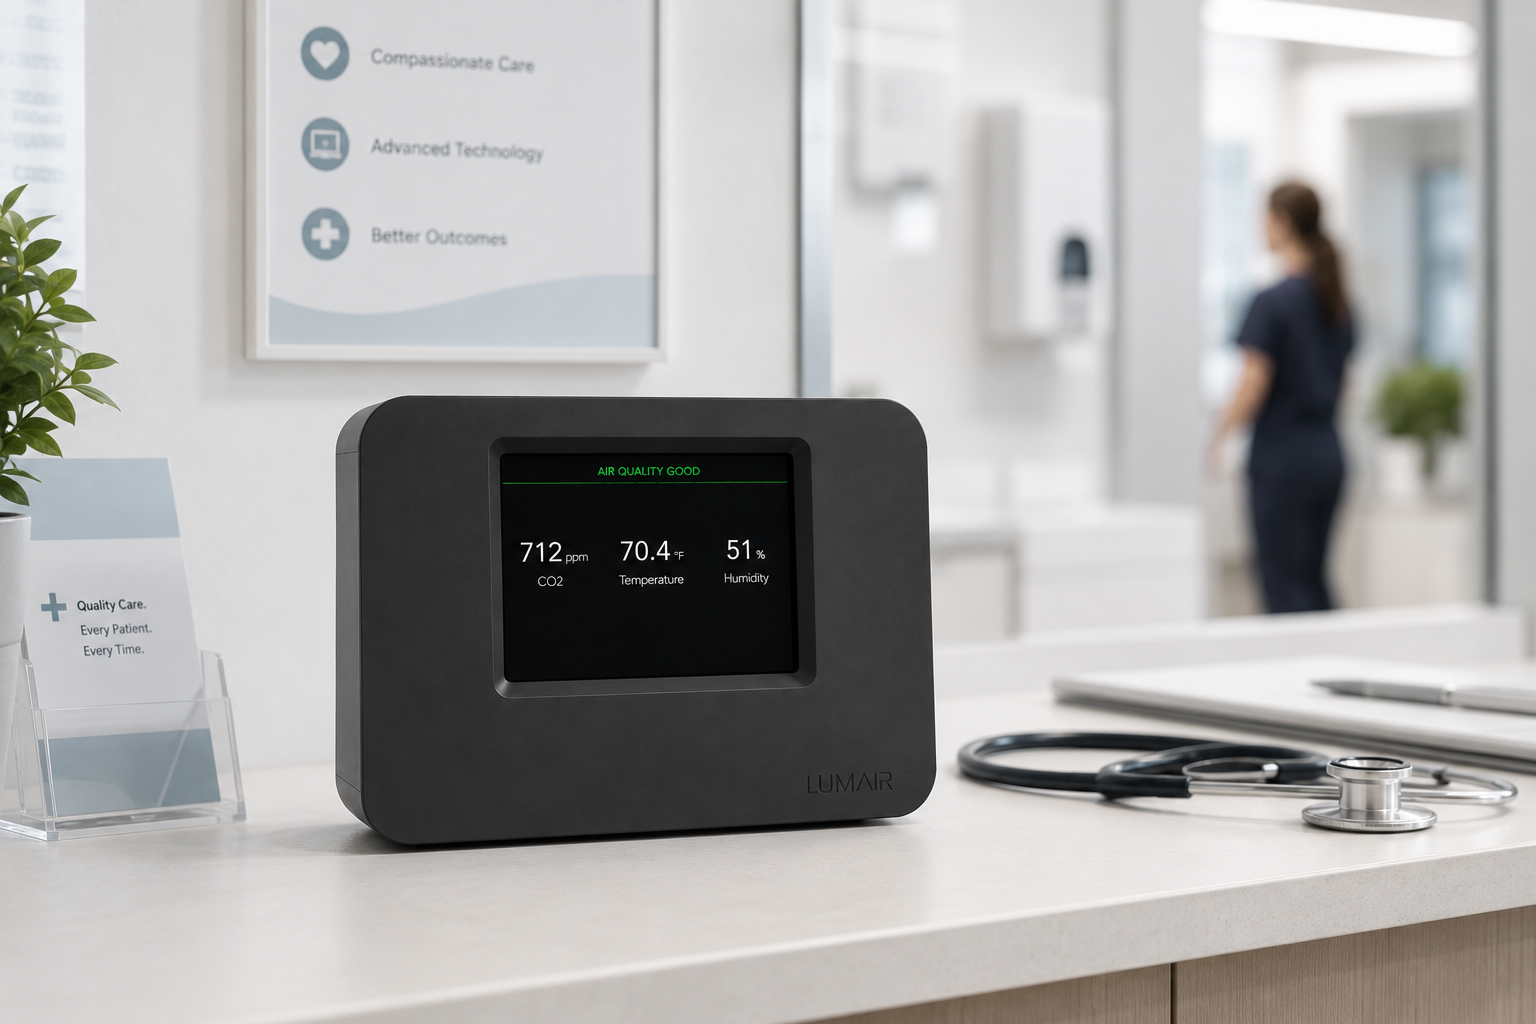
For your clinic
Demonstrate IAQ compliance for patients and staff. Track readings continuously and export historical data for audits, certifications, and ESG reporting.
Why customers choose Lumair.
Built right
- Sensirion SEN66 sensor platform
- 2-year hardware warranty
- 5–6 year sensor lifespan
- Firmware updates over WiFi
Built private
- Your data, your account, your dashboard
- No data sold, no ads, no tracking
- Local network access without internet
- Export everything anytime
Built to last
- No subscription for core features
- Open data via API (coming soon)
- Designed for years of daily use
- Recyclable enclosure and packaging
Common questions.
Start seeing what
you're breathing.
Set up your Lumair in under three minutes.